Image Details
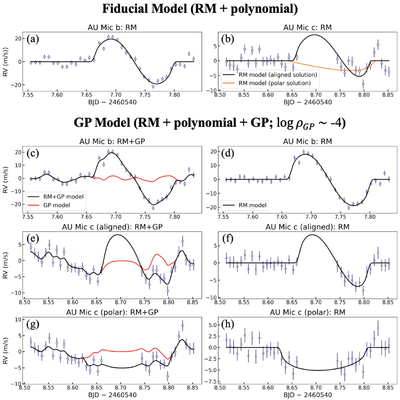
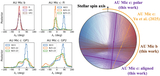
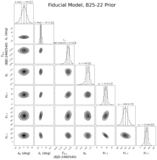
Caption: Figure 5.
Representative modeling results of the RM effect for AU Mic b and c. The best-fit models shown here for b and the aligned solution for c utilize the B25-22 priors (2022 values from Á. Boldog et al. 2025), and the polar solution for c uses the W23 priors (J. M. Wittrock et al. 2023). Additional model plots are provided in Appendix D. Top row: PFS RVs and partial models after subtracting low-order polynomial trends for the fiducial models. Two solutions for c are distinguished by color. Bottom three rows: fitting results for models incorporating GP, again showing two solutions for AU Mic c. In each of these rows, the left panel displays the PFS RVs and the model with the polynomial trend subtracted, leaving the combined RM and GP components. The right panel isolates the RM signal by further subtracting the GP component. The GP fit shown here adopts the timescale prior (﹩\mathrm{log}\rho ﹩) from H. Yu et al. (2025).
Other Images in This Article
Copyright and Terms & Conditions
© 2026. The Author(s). Published by the American Astronomical Society.