Image Details
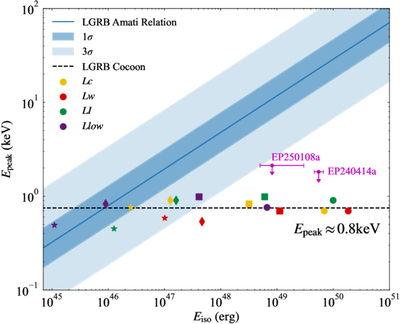
Caption: Figure 9.
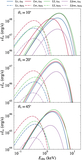
The Eiso versus Epeak diagram. The blue solid line represents the Amati relation for the LGRB population, taken from Y. Liu et al. (2025). The deep blue and light blue shaded regions indicate 1σ and 3σ uncertainties, respectively. The yellow (Lc), red (Lw), green (LI), and purple (Llow) are results in different models, while the circles (θv = 10°), squares (θv = 20°), diamonds (θv = 45°), and stars (θv = 60°) denote different viewing angles. Magenta points denote observed FXTs (EP240414a and EP250108a), for which Epeak only has upper limits.
Other Images in This Article
Show More
Copyright and Terms & Conditions
© 2026. The Author(s). Published by the American Astronomical Society.
Copyright ©
2026 Astronomy Image Explorer. All Rights Reserved.