Image Details
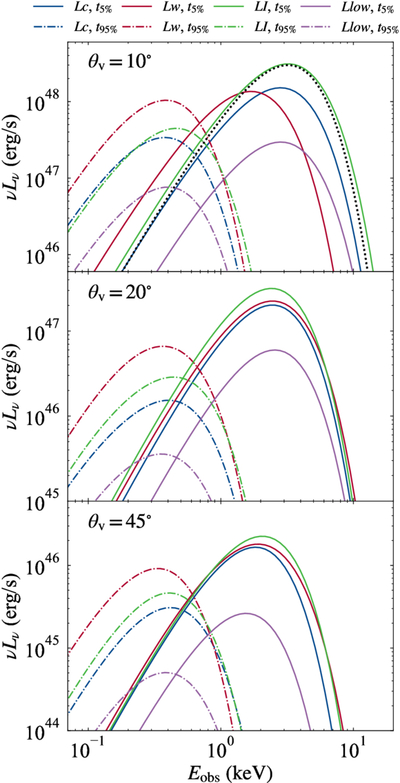
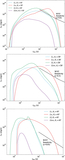
Caption: Figure 7.
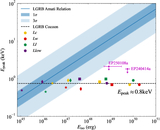
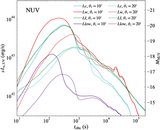
The time-resolved spectra in different models and for different viewing angles. The solid lines are spectra near the beginning of T90 (tobs = t5%), and the dashed lines show the spectra near the end of T90 (tobs = t95%). Colors represent different models, as in Figure 5. The black dashed line on the upper panel is the Planck function with kT = 0.8keV. All spectra are quasi-thermal and only slightly broader than the Planck function.
Other Images in This Article
Show More
Copyright and Terms & Conditions
© 2026. The Author(s). Published by the American Astronomical Society.
Copyright ©
2026 Astronomy Image Explorer. All Rights Reserved.