Image Details
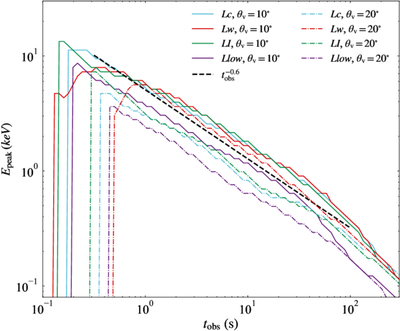
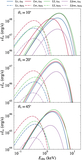
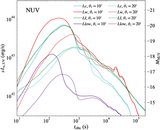
Caption: Figure 8.
The temporal evolutions of the peak energy in different models. Colors represent different models, as in Figure 5. Solid lines (θv = 10°) and dashed–dotted lines (θv = 20°) indicate different viewing angles. The black dashed line shows the power-law decay ﹩{E}_{{\rm{peak}}}\propto {t}_{{\rm{obs}}}^{-0.6}﹩.
Other Images in This Article
Show More
Copyright and Terms & Conditions
© 2026. The Author(s). Published by the American Astronomical Society.
Copyright ©
2026 Astronomy Image Explorer. All Rights Reserved.