Image Details
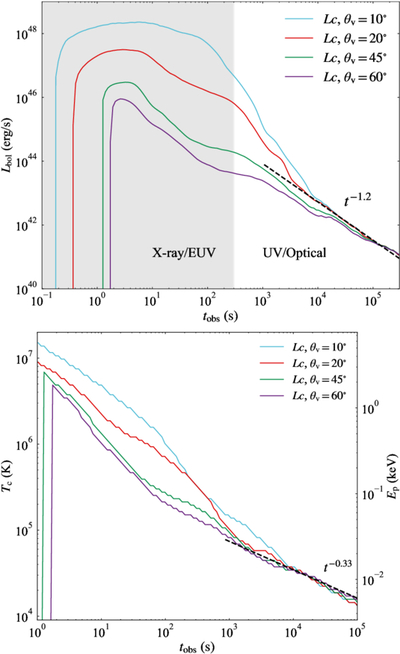
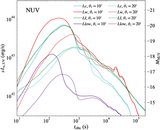
Caption: Figure 2.
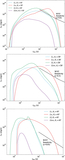
Upper panel: bolometric lightcurves (including all bands, i.e., X-ray/UV/optical) for the Lc model. The blue, red, green, and purple lines correspond to viewing angles of 10°, 20°, 45°, and 60°. Four lightcurves converge at ∼1 day. Lower panel: the evolution of color temperature for the Lc model. The corresponding peak energy Epeak is shown on the right axis.
Other Images in This Article
Show More
Copyright and Terms & Conditions
© 2026. The Author(s). Published by the American Astronomical Society.
Copyright ©
2026 Astronomy Image Explorer. All Rights Reserved.