Image Details
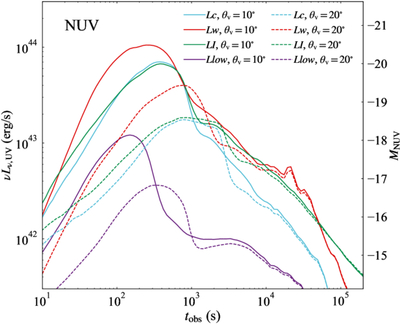
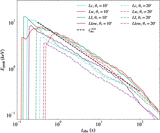
Caption: Figure 10.
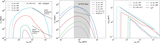
Lightcurves at observer’s wavelength λ = 200 nm (≈NUV band). Colors represent different models, as in Figure 5. Solid lines (θv = 10°) and dashed lines (θv = 20°) indicate different viewing angles. The left axis shows the luminosity, while the right axis gives the corresponding absolute magnitude.
Other Images in This Article
Show More
Copyright and Terms & Conditions
© 2026. The Author(s). Published by the American Astronomical Society.
Copyright ©
2026 Astronomy Image Explorer. All Rights Reserved.