Image Details
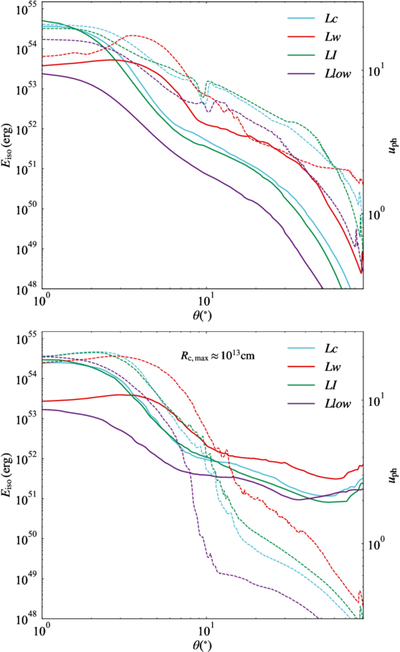
Caption: Figure 3.
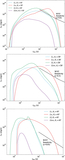
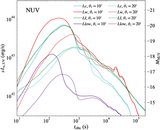
The angular distributions of the isotropic-equivalent energy Eiso (solid lines, left axis) and the photospheric four-velocity uph (dashed lines, right axis) for the four models. The blue, red, green, and purple lines correspond to models Lc, Lw, LI, and Llow, respectively. The upper panel shows the distribution at ﹩{R}_{{\rm{c}},{\rm{\max }}}\approx 1{0}^{12}\,{\rm{cm}}﹩, while the lower panel shows shows those at ﹩{R}_{{\rm{c}},{\rm{\max }}}\approx 1{0}^{13}\,{\rm{cm}}﹩.
Other Images in This Article
Show More
Copyright and Terms & Conditions
© 2026. The Author(s). Published by the American Astronomical Society.
Copyright ©
2026 Astronomy Image Explorer. All Rights Reserved.