Image Details
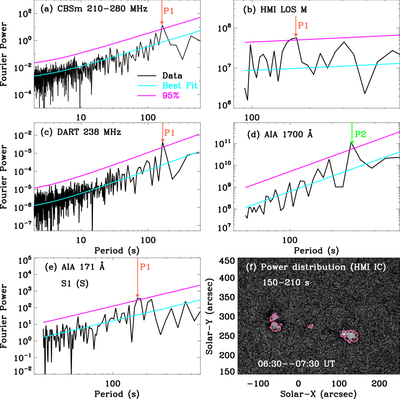
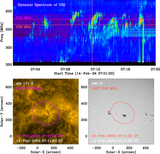
Caption: Figure 4.
Period analysis. (a)–(e) Fourier power spectra in wave bands of CBSm 210–280 MHz, HMI LOS magnetogram, DART 238 MHz (polarization), and AIA 171 Å and 1700 Å. The lines in each panel represent the best fit (cyan) and the confidence level at 95% (magenta). The arrows outline the dominant periods above the confidence level. (f) Fourier power maps averaged over 150–210 s, obtained from HMI continuum maps. The overlaid contours outline the sunspot umbrae.
Other Images in This Article
Copyright and Terms & Conditions
© 2026. The Author(s). Published by the American Astronomical Society.
Copyright ©
2026 Astronomy Image Explorer. All Rights Reserved.