Image Details
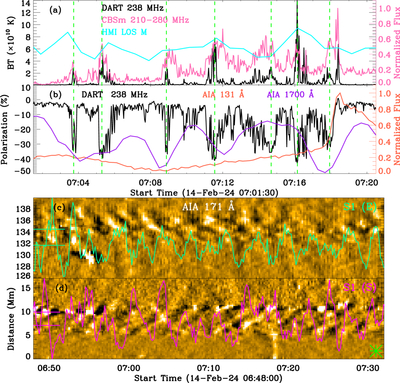
Caption: Figure 3.
(a) Local radio flux integrated over the source region at DART 238 MHz, and full-disk radio flux integrated over the frequency range of CBSm 210–280 MHz, as well as the net magnetic flux measured by HMI. (b) Degree of circular polarization in the frequency of DART 238 MHz. Local UV/EUV fluxes observed by AIA 1700 Å and 131 Å. (c)–(d) Detrended TD maps along S1 at AIA 171 Å. The overplotted curves are the time series extracted between the two short lines on the left. The asterisk indicates the start position.
Other Images in This Article
Copyright and Terms & Conditions
© 2026. The Author(s). Published by the American Astronomical Society.
Copyright ©
2026 Astronomy Image Explorer. All Rights Reserved.