Image Details
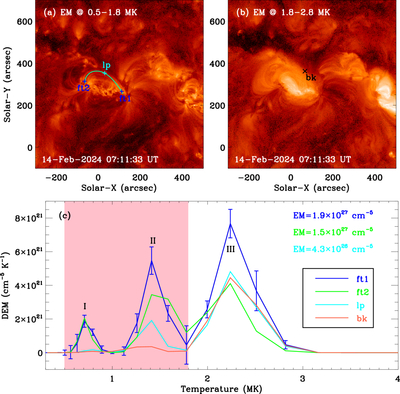
Caption: Figure 5.
DEM analysis results. (a) and (b) EM maps with an FOV of about 800″ × 800″ integrated in temperature ranges of 0.5–1.8 and 1.8–2.8 MK, respectively. The blue and cyan pluses mark double footpoints (ft1 and ft2) and loop top (lp) connected by the coronal loop (green curve), and the black cross marks the background position. (c) DEM profiles at the selected positions along the loop and in one location away from the loop. For clarity, only the error bars at one position are shown. The pink region outlines the temperature range used to integrate the EM.
Other Images in This Article
Copyright and Terms & Conditions
© 2026. The Author(s). Published by the American Astronomical Society.
Copyright ©
2026 Astronomy Image Explorer. All Rights Reserved.