Image Details
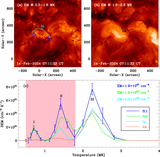
Caption: Figure 2.
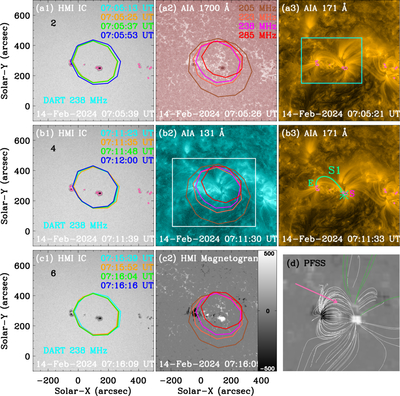
Images of the source during type-I burst chains. (a1)–(c2) Submaps with an FOV of about 800″ × 800″ during burst chains 2, 4, and 6. They were measured by HMI continuum and LOS magnetogram, AIA 1700 Å, 171 Å, and 131 Å. The overlaid contours are detected by DART, and the levels are set at 50% of the local maximum values. The hot pink contours outline sunspot umbrae. The cyan and white rectangles outline integrated regions of AIA/HMI and DART. The green curves (S1) outline a loop system generated for TD map; the asterisk indicates its start point. (d) Magnetic field lines extrapolated from a PFSS model.
Other Images in This Article
Copyright and Terms & Conditions
© 2026. The Author(s). Published by the American Astronomical Society.