Image Details
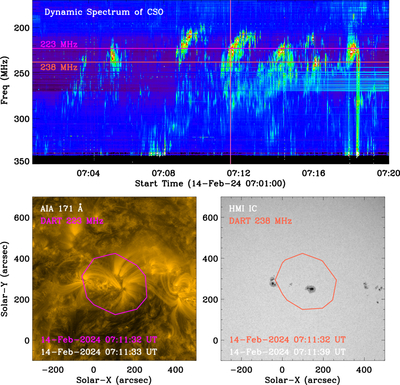
Caption: Figure A2.
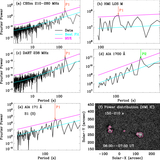
Upper: radio dynamic spectrum measured by CBSm. The vertical line mark the time shown in the lower panel, and two horizontal lines outline the frequency at 223 and 238 MHz. Bottom: submaps with an FOV of about 800″ × 800″, which were measured by AIA 171 Å and the HMI continuum; the overlaid contours represent radio emissions in frequencies of 223 and 238 MHz. An animation of this figure is available. It shows the evolution of solar meterwave bursts from 07:01 UT to 07:20 UT on 2024 February 14. The real-time duration of the animation is about 8.5 s.
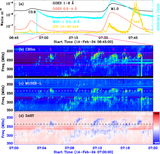
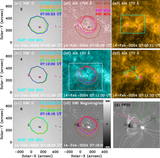
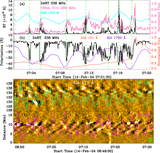
(An animation of this figure is available in the online article.)
(An animation of this figure is available.)
The video/animation of this figure is available in the online journal.
Other Images in This Article
Copyright and Terms & Conditions
© 2026. The Author(s). Published by the American Astronomical Society.