Image Details
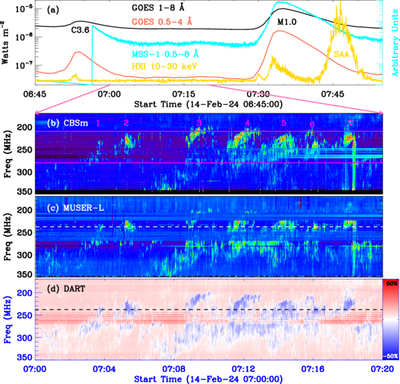
Caption: Figure 1.
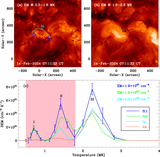
Overview of type-I burst chains on 2024 February 14. (a) SXR/HXR light curves recorded by GOES, MSS-1, and HXI during 06:45–07:55 UT; two solar flares are marked. (b) Dynamic spectrum of CBSm between 07:00 and 07:20 UT. Two horizontal lines outline the frequency range of solar meterwave bursts (1–7). (c) Dynamic spectrum of MUSER-L. The white dashed line marks the frequency at 238 MHz. (d) Dynamic spectrum of polarization measured by DART. The dashed line marks the frequency at 238 MHz.
Other Images in This Article
Copyright and Terms & Conditions
© 2026. The Author(s). Published by the American Astronomical Society.
Copyright ©
2026 Astronomy Image Explorer. All Rights Reserved.