Image Details
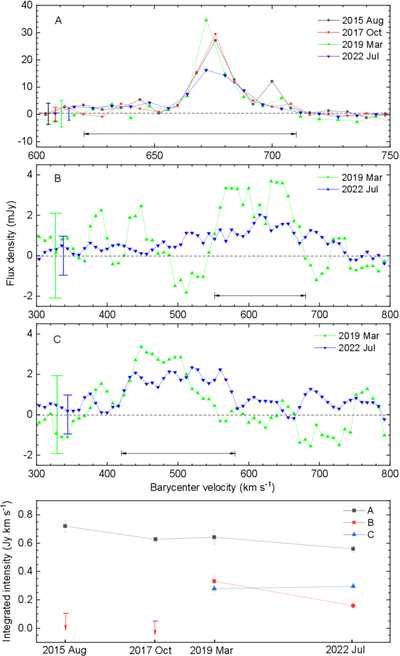
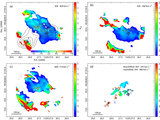
Caption: Figure 7.
Variability of the 36.2 GHz methanol maser in NGC 4945 across four epochs. Top three panels: Spectral profiles of the 36.2 GHz maser emission for the three main spatial Complexes A, B, and C (identified in Figure 2), observed at four epochs: 2015 August, 2017 October, 2019 March, and 2022 July with the ATCA. The vertical bars indicate 3σ uncertainties in the flux density measurements per spectral channel. The horizontal bars above each spectrum indicate the velocity range used to compute the integrated intensity shown in the bottom panel. Bottom panel: Temporal evolution of the integrated maser intensity (in Jy km s−1) for complexes A, B, and C over the four epochs. The integrated flux is calculated over the velocity ranges highlighted in the corresponding spectral plots above. For the B and C components observed in 2015 and 2017, an upper limit of 4 × 3σrms in units of Jy km s−1 is provided, indicating the threshold for nondetection. This panel quantifies the overall strength variation of masing gas in each complex, revealing different variability patterns and timescales among them.
Other Images in This Article
Copyright and Terms & Conditions
© 2026. The Author(s). Published by the American Astronomical Society.