Image Details
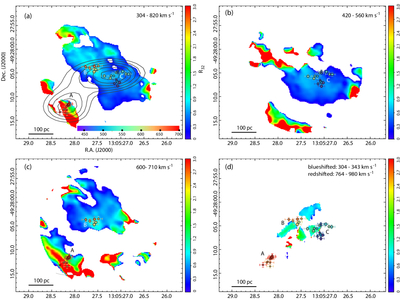
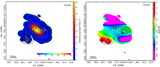
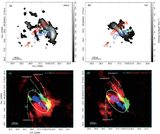
Caption: Figure 4.
Spatial distribution of the CO line ratio R32 and its correlation with methanol masers in NGC 4945. Panel (a): R32 map derived from emission integrated over the full velocity range of the galactic disk (304–820 km s−1). Panels (b) and (c): R32 maps computed from velocity intervals that closely match the velocities of the methanol maser complexes: (b) 420–560 km s−1 and (c) 600–710 km s−1. Panel (d): R32 map for gas in the high-velocity outflow wings (blueshifted: 304–343 km s−1; redshifted: 764–980 km s−1), tracing excitation conditions within the powerful nuclear outflow. The 36.2 GHz Class I methanol masers are overlaid as colored circles (same as in Figure 2). Notably, only pixels where the integrated intensity of both CO transitions exceeds 3σ are shown to avoid noise-dominated regions. The high and low R32 values near the map edges are subject to larger uncertainties due to weaker line emission; our analysis focuses on the maser complexes, which lie in regions of high signal-to-noise and are reliably measured.
Other Images in This Article
Copyright and Terms & Conditions
© 2026. The Author(s). Published by the American Astronomical Society.