Image Details
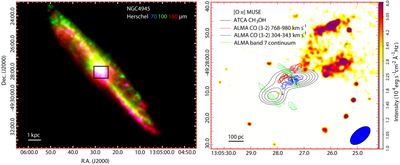
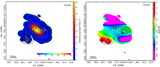
Caption: Figure 1.
Panoramic view of NGC 4945 with multiwavelength tracers. Left: A large-scale, three-color composite image of the galaxy NGC 4945 from Herschel. Emissions at 70 μm, 100 μm, and 160 μm are coded in blue, green, and red, respectively. The black box marks the central nuclear region, which is shown in detail in the right panel. Right: A zoomed-in view of the central region. The background color map shows the ionized gas morphology traced by the [O III] λ5007 Å line emission observed with the VLT/MUSE. The integrated 36.2 GHz Class I methanol maser emission (black contours at levels of 0.2, 0.25, 0.3, 0.35, 0.4, and 0.45 Jy beam−1 km s−1) and the high-velocity molecular outflows are overlaid. The methanol maser map was constructed from combined ATCA data obtained in 2019 March and 2022 August; its synthesized beam (∼9﹩\mathop{.}\limits^{^{\prime\prime} }﹩1 × 4﹩\mathop{.}\limits^{^{\prime\prime} }﹩5) is indicated by the blue ellipse at the bottom right. The outflows, traced by the line wings of the ALMA CO(J = 3–2) observation, are shown as blue contours for the blueshifted component (304–343 km s−1) and red contours for the redshifted component (768–980 km s−1), with contour levels of 0.02, 0.1, 0.5, 1, 1.5, 2, and 4 Jy beam−1 km s−1. Additionally, the 870 μm (Band 7) continuum emission from ALMA, outlining the dust distribution around the AGN, is represented by green contours at levels of 0.005, 0.01, 0.02, 0.04, 0.06, and 0.08 Jy beam−1. The nucleus is marked by the red cross (E. Bellocchi et al. 2023).
Other Images in This Article
Copyright and Terms & Conditions
© 2026. The Author(s). Published by the American Astronomical Society.