Image Details
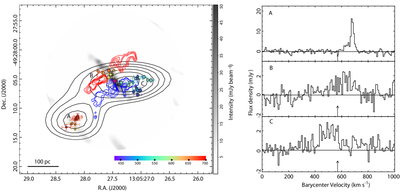
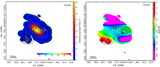
Caption: Figure 2.
Spatial distribution and spectral profiles of the 36.2 GHz methanol masers in NGC 4945. Left: Map of the 36.2 GHz Class I methanol masers overlaid on the 870 μm continuum emission (grayscale) observed with ALMA Band 7. Individual maser spots are represented by filled circles, where the circle size scales with the maser flux density and its color indicates the barycentric velocity (see the color bar). The black contours trace the integrated maser emission, identical to those in Figure 1. For context, the red and blue contours outline the high-velocity molecular outflows traced by ALMA CO (J = 3–2) line wings (blueshifted: 304–343 km s−1; redshifted: 780–980 km s−1), with contour levels matching those in Figure 1. The three primary spatial concentrations of maser emission are labeled A, B, and C. Right: Spectral-line profiles of the 36.2 GHz methanol maser emission extracted from the regions A, B, and C marked in the left panel. The vertical arrow marks the systemic velocity of NGC 4945 (Vsys = 563 km s−1; C. Beltrand et al. 2024). Both the maser spot distribution (left) and the spectral profiles (right) are derived by combining ATCA data conducted in 2019 March and 2022 August.
Other Images in This Article
Copyright and Terms & Conditions
© 2026. The Author(s). Published by the American Astronomical Society.