Image Details
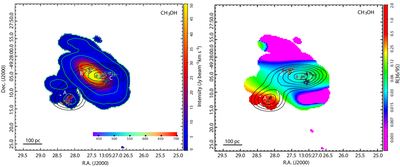
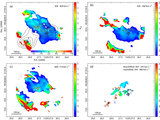
Caption: Figure 5.
Distributions of thermal methanol and the I36.2/I96.7 intensity ratio in NGC 4945. Left panel: Integrated intensity (moment 0) map of the thermal CH3OH 2−1 line at 96.7 GHz, observed with ALMA. The green contours represent intensity levels of 0.2, 1, 5, 25, and 50 Jy beam−1 km s−1. Right panel: Map of the integrated intensity ratio I36.2/I96.7, where I36.2 is the integrated intensity of the 36.2 GHz maser line (from ATCA) and I96.7 is that of the thermal 96.7 GHz lines (from ALMA). In both panels, the 36.2 GHz maser integrated emission and individual spots are overlaid as black contours and colored circles, respectively, following the convention of Figure 2.
Other Images in This Article
Copyright and Terms & Conditions
© 2026. The Author(s). Published by the American Astronomical Society.