Image Details
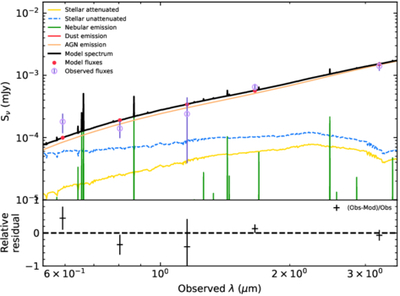
Caption: Figure A3.
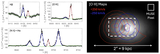
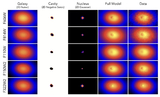
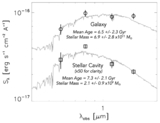
This figure, produced using the PCIGALE software (M. Boquien et al. 2019; G. Yang et al. 2022), shows the fluxes obtained for the central point source in each filter based on the two-dimensional image decomposition described in previous sections. This SED is well-described by a power law at all wavelengths. We model these data using PCIGALE, allowing for the combination of a two-stage star formation history, nebular emission, and an AGN, finding that the emission is best described by an AGN with contributions from nebular lines at the shortest wavelengths. The fact that these data are well-described by a single power law, despite being obtained over the course of 20 yr, suggests minimal time variability in the central point source.
Other Images in This Article
Copyright and Terms & Conditions
© 2026. The Author(s). Published by the American Astronomical Society.