Image Details
Caption: Figure 2.
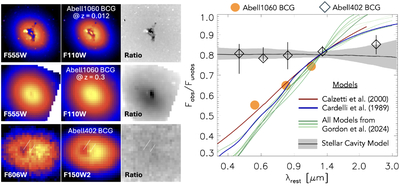
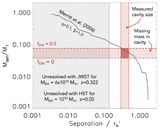
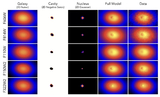
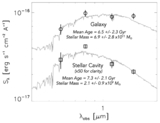
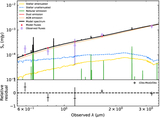
Left: comparison of the dark patch in A1060-BCG and A402-BCG. In the upper row, we show F555W and F110W observations of the central galaxy in A1060 (z = 0.012), which has a well-known ring of dust in the inner kiloparsec. The F555W image has been smoothed and rebinned to match the F110W image. In the right column, we show the ratio of these two images, which highlights the wavelength-dependent intensity of the dust ring. In the middle row, we have simulated how A1060 would appear at z = 0.3 by adjusting the binning/smoothing based on the larger angular diameter distance—the dust ring now appears to be an unresolved cavity in the galaxy center, similar to what is observed in A402. The dust feature is still highly significant in the ratio image. In the bottom panel, we show A402, where we have smoothed and rebinned the F150W2 data to match the F606W image. In this case, the ratio image contains no structure, suggesting that the observed cavity is missing stars, rather than dust. Right: Intensity of the dark patch compared to the expectation value from a symmetric model, as a function of wavelength for A402-BCG (diamonds) and A1060-BCG (orange circles). This figure shows that the constant depth of the cavity in A402 with wavelength (dashed line) is inconsistent with predictions from extinction models. We compare to the standard models for the Milky Way (blue; J. A. Cardelli et al. 1989) and for the starburst galaxies (red; D. Calzetti et al. 2000), but also compare to eight models that span different regions in the LMC, SMC, Milky Way, M31, and M33 (green; K. Gordon 2024). All of these models predict a factor of ∼4 difference in rest-frame extinction between the F150W2 and F606W bands. In contrast, the feature in A1060-BCG is fully consistent with dust. We also compare to a simple model in which we remove a cylindrical volume of stars from the midplane of the galaxy, with spectral shape based on the measured color gradient of the galaxy—this model (in gray) describes the data excellently.
Other Images in This Article
Copyright and Terms & Conditions
© 2026. The Author(s). Published by the American Astronomical Society.