Image Details
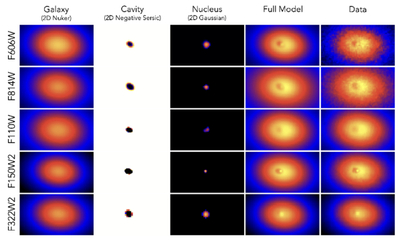
Caption: Figure A1.
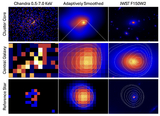
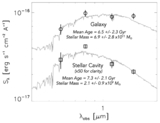
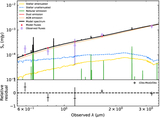
The surface photometry for the central galaxy in A402 has been modeled using a combination of a Nuker profile (A. W. Graham et al. 2003) for the “galaxy,” a negative-intensity Sérsic profile for the “cavity,” and a pointlike Gaussian for the “nucleus,” all convolved with the instrumental PSF. All models shown represent the average model fit when marginalizing over variations in the PSF and the count rate. The component models are shown without the PSF convolution applied, while the “full model” panels include the instrumental PSF. This figure demonstrates that the large variations in the observations can be attributed to a central AGN with a steep wavelength dependence and a PSF that is a factor of two larger at F110W and F322W2 compared to F606W, F814W, and F150W2. This image decomposition allows us to accurately measure the total flux missing in the cavity (Figure 2), the SED of the missing stars in the cavity and the galaxy (Figure A2), and the spectral energy distribution of the point source (Figure A3).
Other Images in This Article
Copyright and Terms & Conditions
© 2026. The Author(s). Published by the American Astronomical Society.