Image Details
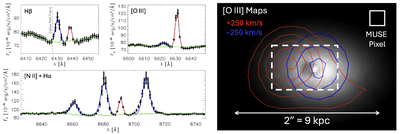
Caption: Figure 4.
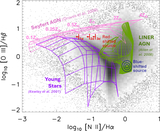
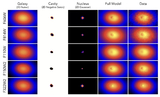
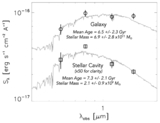
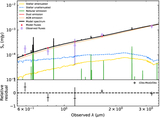
Left: integrated spectra from a 1″ wide region centered on the stellar cavity, showing the brightness of various lines. The two velocity components are clearly offset, with the blueshifted source having LINER-like emission-line ratios (low [O III]/Hβ ratio, high [N II]/Hα ratio), while the redshifted source has very bright [O III] emission but no detectable [N II]. In the Hβ panel, the rest-frame velocity of the galaxy is shown for comparison. In all panels, the green line represents the empirical continuum model, extracted from a nearby region free of emission lines and rescaled in intensity to fit the central region. Right: zoomed-in image of the central galaxy in A402 in the F150W2 band. The white rectangle shows the extraction area for the MUSE spectra shown on the left. Red and blue contours show the intensity of the two kinematic components of [O III]λ5007 shown on the left. This figure demonstrates the presence of two highly ionized, pointlike sources on either side of the stellar cavity, with high relative velocities. The eastern (redshifted) source, while compact, appears to be embedded in a larger (∼10 kpc) blob of highly ionized gas.
Other Images in This Article
Copyright and Terms & Conditions
© 2026. The Author(s). Published by the American Astronomical Society.