Image Details
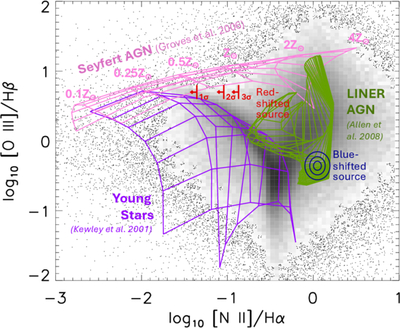
Caption: Figure 5.
Line ratio diagram, comparing high-ionization ([O III]/Hβ) and low-ionization ([N II]/Hα) line ratios (J. A. Baldwin et al. 1981), which separates star-forming regions from active galactic nuclei and is insensitive to the effects of dust. The black/gray points in the background represent 85,224 galaxies with spectra from the Sloan Digital Sky Survey (L. J. Kewley et al. 2006). Where the point density becomes sufficiently high, we transition to a 2D histogram. There is a dense locus of points that are consistent with predictions for H II regions (L. J. Kewley et al. 2001) (purple grid). The blueshifted source on the western side of the stellar cavity has line ratios consistent with LINER AGN (T. M. Heckman 1980; M. G. Allen et al. 2008; green grid) and is inconsistent with models of star formation. The redshifted source on the eastern side of the stellar cavity has no detectable [N II] emission, and so appears here as an upper limit in [N II]/Hα. This source is fully consistent with models of Seyfert-like AGN with low-metallicity gas (B. A. Groves et al. 2006) (pink grid), but is also marginally consistent with a very young and energetic starburst. We rule out the latter scenario based on the lack of blue continuum emission, which would have been clearly visible in the archival HST data at F606W.
Other Images in This Article
Copyright and Terms & Conditions
© 2026. The Author(s). Published by the American Astronomical Society.