Image Details
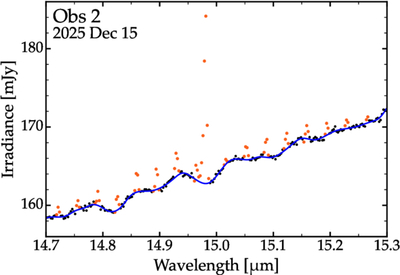
Caption: Figure 6.
An example of the continuum modeling procedure applied to prepare the extracted JWST/MIRI spectra for retrieval analysis. The data points are the irradiance spectrum in subband 3B obtained from Observation 2 using a 2″–3″ annular aperture. The orange points denote the wavelengths that contain CO2 fluorescence emission, here masked prior to continuum modeling. The blue curve is the cubic spline fit to the continuum wavelengths, with the smoothing threshold set to 2.5n, where n is the number of continuum data points. See the text for more details.
Other Images in This Article

Copyright and Terms & Conditions
© 2026. The Author(s). Published by the American Astronomical Society.
Copyright ©
2026 Astronomy Image Explorer. All Rights Reserved.