Image Details
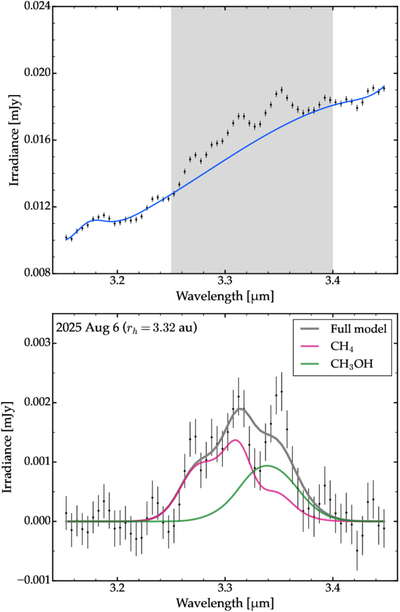
Caption: Figure 4.
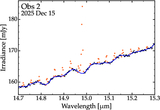
Top: the JWST/NIRSpec PRISM spectrum of 3I in the vicinity of the CH4 ν3 fluorescence band (black points). The shaded region denotes the wavelength range that includes the detected emission bands, which was masked prior to continuum fitting. The blue curve is the cubic spline fit to the continuum points. Bottom: the continuum-subtracted spectrum (black points), with the best-fit PSG model overplotted. The gray curve corresponds to the full model, with the individual contributions from CH4 and CH3OH plotted in magenta and green, respectively.
Other Images in This Article
Copyright and Terms & Conditions
© 2026. The Author(s). Published by the American Astronomical Society.
Copyright ©
2026 Astronomy Image Explorer. All Rights Reserved.