Image Details
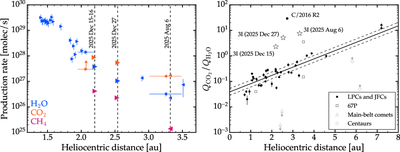
Caption: Figure 5.
Left: a compilation of H2O, CO2, and CH4 production rates for 3I published in M. R. Combi et al. (2026), M. A. Cordiner et al. (2025), C. M. Lisse et al. (2025), Z. Xing et al. (2025), C. M. Lisse et al. (2026), and this work, plotted as a function of heliocentric distance. The JWST epochs (both NIRSpec and MIRI) are marked with vertical dashed lines. The MIRI measurements and the ﹩{Q}_{{{\rm{CH}}}_{4}}﹩ value obtained from the reanalysis of the NIRSpec observations are shown with larger symbols. Left-facing triangles denote preperihelion measurements, and vice versa. Right: CO2-to-H2O production ratios versus heliocentric distance for various active objects, sorted by dynamical class, with 3I’s measurements marked with the star symbols. This plot is a reproduction of Figure 6 in M. A. Cordiner et al. (2025; see the references therein), with the new JWST/MIRI-derived values added. The solid and dashed black lines indicate the best-fit log-linear trend and associated 1σ bounds for the population of LPCs and JFCs, excluding the exceptionally CO2-rich object C/2016 R2. The measured CO2:H2O mixing ratios for 3I are significantly enriched relative to the trend, as is the case for C/2016 R2. See the text for details.
Other Images in This Article
Copyright and Terms & Conditions
© 2026. The Author(s). Published by the American Astronomical Society.