Image Details
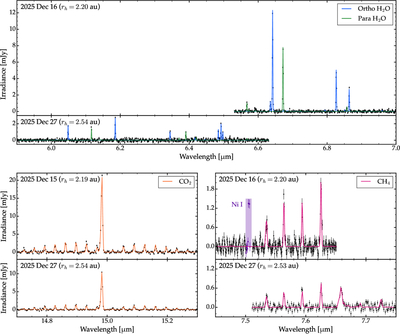
Caption: Figure 2.
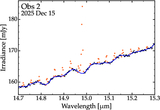
Top: continuum-subtracted JWST/MIRI spectra of 3I in the ν2 band of H2O from both epochs, with the best-fit PSG coma fluorescence models overlaid. For the H2O and CO2 analyses, spectra were extracted using a 2″–3″ annular aperture, to avoid optically thick regions, while for CH4, a circular 3″ diameter aperture was applied. The plotted error bars are based on the measured uncertainties from the spectral extractions and have been scaled to yield a reduced χ2 of unity for the best-fit models. The contributions from ortho- and para-H2O are shown separately in blue and green, respectively. The line intensities are significantly lower in the second epoch, corresponding to a sizable decrease in H2O production. Bottom left: analogous fits to the ν2 band of CO2. Bottom right: CH4 fluorescence model and data. The emission feature highlighted in purple at 7.5066 μm is from the ground-state forbidden transition of Ni I. To illustrate the systematic decrease in production between the two epochs, the vertical scale is identical within each set of panels.
Other Images in This Article
Copyright and Terms & Conditions
© 2026. The Author(s). Published by the American Astronomical Society.