Image Details
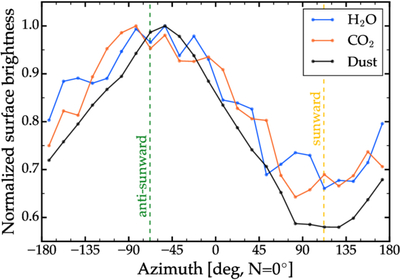
Caption: Figure 7.
Azimuthal profiles of H2O (blue) and CO2 (orange) at ﹩0\mathop{.}\limits^{^{\prime\prime} }8﹩–﹩1\mathop{.}\limits^{^{\prime\prime} }5﹩ from the optocenter, derived from Observations 6 and 15, respectively. The profile of the local dust continuum within the CO2 primary band is also shown. The azimuth increases eastward, with north at 0°. The sunward and antisunward directions are indicated by the yellow and green vertical dashed lines, respectively.
Other Images in This Article
Copyright and Terms & Conditions
© 2026. The Author(s). Published by the American Astronomical Society.
Copyright ©
2026 Astronomy Image Explorer. All Rights Reserved.