Image Details
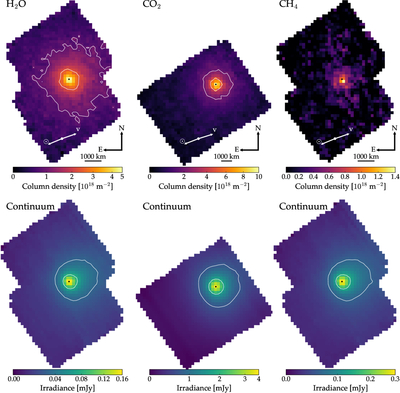
Caption: Figure 3.
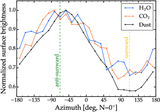
Top: coma maps of H2O, CO2, and CH4, computed as the molecular column density from a pixel-by-pixel retrieval analysis for Observations 6, 15, and 6, respectively. The sunward and target velocity directions are denoted by the white arrows. The target centroids, computed as the photocenter in the median-stacked images (Figure 1), are marked with the black points. For H2O and CO2, the white contours correspond to emission levels of 50% and 20% relative to the maximum value and illustrate the slight antisunward extension of the respective comae. The contours are omitted in the CH4 panel, due to the poorer signal-to-noise ratio of the data. Bottom: corresponding median-stacked images across the continuum wavelengths within each fluorescence region. The H2O coma map shows a significant enhancement in the emission level at large nucleocentric distances relative to the dust continuum, indicating extended H2O production within the coma.
Other Images in This Article
Copyright and Terms & Conditions
© 2026. The Author(s). Published by the American Astronomical Society.