Image Details
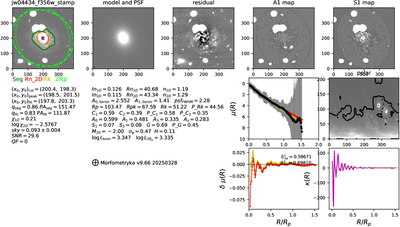
Caption: Figure A3.
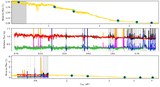
Standard MFMTK output, in the 356 band. The top row shows the galaxy image (first box) and the masked regions (in white). The light-green contour shows the Petrosian region, where the parameters are measured. The recovered parameters are shown below. The second image shows a single Sérsic fit. Both the 1D and 2D fits are shown. The 2D recovered Sérsic index is n ≃ 1.3. In the third box is presented the residual image (image – model), which clearly shows asymmetry in the spiral arms, suggesting that it could be a lopsided galaxy. The fourth and fifth panels show the asymmetry map and the smoothness, respectively. The other four boxes show the surface brightness profile, the polar map, and the second derivative of the galaxy light profile, i.e., the curvature (G. Lucatelli & F. Ferrari 2019), which is consistent with a disk galaxy (k = 0).
Other Images in This Article
Show More
Copyright and Terms & Conditions
© 2026. The Author(s). Published by the American Astronomical Society.