Image Details
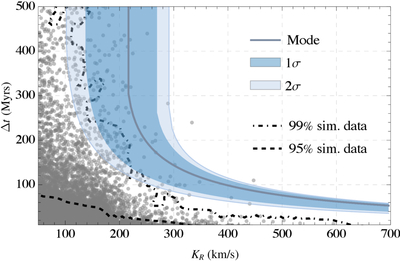
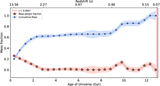
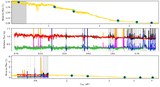
Caption: Figure 5.
The time interval Δt, as a function of the radial kick velocity component KR, for the binary system to travel from an initial radius R0 to the observed kilonova location. The solid curve labeled “mode” assumes that the galaxy parameters (﹩{\delta }_{\star },{\rm{\Delta }}i,\mathrm{log}c,\mathrm{log}{r}_{200}﹩) are given by their best-fit values and that the initial radius is the most probable one, R0 = h. The shaded regions are the 1σ and 2σ credible intervals obtained by marginalizing over galaxy parameters and the initial position. The gray circles are simulated events from SEVN (several of them have close to zero or negative KR values and do not appear in the plot). The black dashed and dotted–dashed curves show the 95% and 99% smooth limits, respectively, obtained from a KDE of the simulation data points.
Other Images in This Article
Show More
Copyright and Terms & Conditions
© 2026. The Author(s). Published by the American Astronomical Society.