Image Details
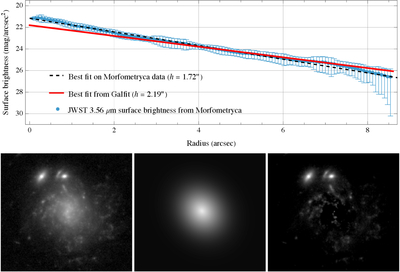
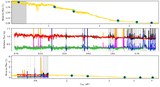
Caption: Figure 2.
Top: surface brightness profile obtained extracting the galaxy light in elliptical bins, following the galaxy axis ratio, of increasing radius, shown as blue circles with error bars. The black dashed line represents the 1D fit of these data, assuming an exponential profile. The red line shows the output of the 2D GALFIT for an exponential profile, which leads to a larger disk scale length (h) than the previous case. Bottom: GALFIT fit. Left: image; middle: model; right: residuals.
Other Images in This Article
Show More
Copyright and Terms & Conditions
© 2026. The Author(s). Published by the American Astronomical Society.
Copyright ©
2026 Astronomy Image Explorer. All Rights Reserved.