Image Details
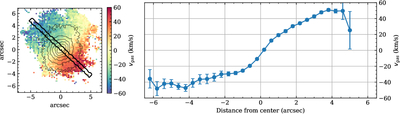
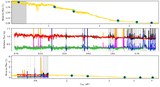
Caption: Figure 3.
Left: velocity map of the Hα emission (see Section 3). The solid black line represents the path of virtual extractions. A clear rotation pattern can be discerned in this map. Right: the rotation curve extracted from the map on the left, with error bars indicating the 1σ interval of uncertainty.
Other Images in This Article
Show More
Copyright and Terms & Conditions
© 2026. The Author(s). Published by the American Astronomical Society.
Copyright ©
2026 Astronomy Image Explorer. All Rights Reserved.