Image Details
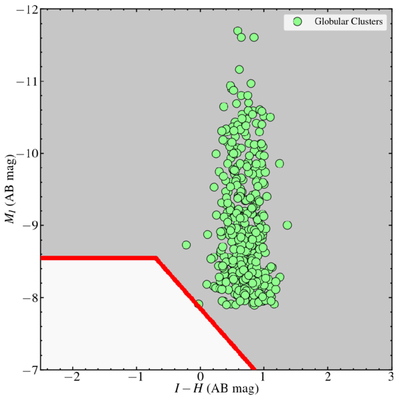
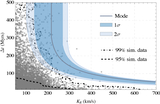
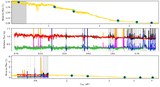
Caption: Figure 1.
A color–magnitude diagram of a sample of GCs from J. P. Blakeslee et al. (2012) in I and H band compared with limits on a counterpart to GRB 230307A in F070W and F150W. The red line corresponds to our joint detection threshold to point sources in F070W and F150W, with the gray region containing detected point sources and the white region containing undetected point sources. We rule out nearly all of the GCLF, implying that it is extremely unlikely that the progenitor of GRB 230307A formed in situ in a GC.
Other Images in This Article
Show More
Copyright and Terms & Conditions
© 2026. The Author(s). Published by the American Astronomical Society.
Copyright ©
2026 Astronomy Image Explorer. All Rights Reserved.