Image Details
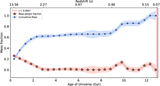
Caption: Figure E1.
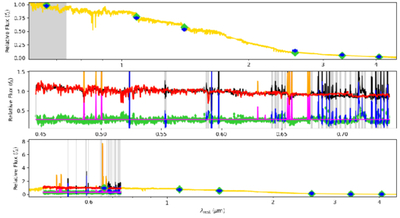
Fit used to estimate the spectral mass of the host galaxy. Top: best-fitting template using E-MILES templates shown as a golden line. Blue points with error bars indicate photometric measurements from JWST. The gray area corresponds to the wavelength range covered by the MUSE spectrum shown in the middle panel. Middle: observed spectrum in black, pPXF best-fitting total spectrum in orange, emission lines in magenta, masked outliers in blue, and residuals indicated with green diamonds. Bottom: combined spectra and photometric measurements.
Other Images in This Article
Show More
Copyright and Terms & Conditions
© 2026. The Author(s). Published by the American Astronomical Society.
Copyright ©
2026 Astronomy Image Explorer. All Rights Reserved.