Image Details
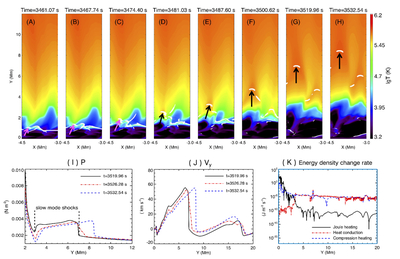
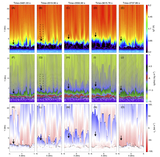
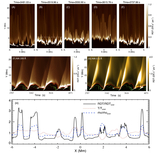
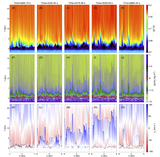
Caption: Figure 6.
The slow-mode shocks above the spicules in the lower corona. Panels (A)–(H) show the temperature distributions at eight different times in the zoomed-in region inside the black dashed box in Figures 4(B) and (G), where the white contour lines outline the positions having large values of − ∇ · V (shock fronts), the thick pink or black arrows point to the shock front that triggered by plasma upflows during the rising phase of a growing spicule on the left-hand side, and these thick arrows also represent the spicule upflows below the shock front. The distributions of gas pressure P, velocity in the Y-direction VY, and the absolute values of the energy density change rate along the Y-direction at X = −4.15 Mm are presented in panels (I), (J), and (K). The black solid line, the red dashed–dotted line, and the blue dashed line in panels (I) and (J) mark the values at three different times when the shock fronts are located in the corona. The various lines in (K) indicate the absolute values of the energy density change rate contributed by the Joule heating (﹩\eta {J}_{z}^{2}﹩), the heat conduction (− ∇ · Fc), and the compression heating (−P ∇ · V) at t = 3519.96 s, respectively.
Other Images in This Article
Show More
Copyright and Terms & Conditions
© 2026. The Author(s). Published by the American Astronomical Society.