Image Details
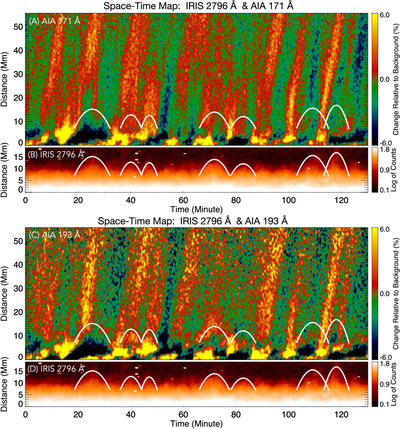
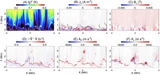
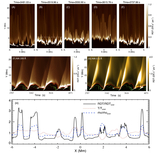
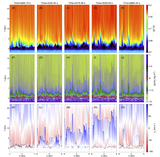
Caption: Figure 2.
Time–distance maps corresponding to the slits marked in panels (C)–(E) of Figure 1. The slanted bright ridges extending over large distances represent PDs observed in the AIA 171 and 193 Å channels. The IRIS 2796 Å time–distance maps show the evolution of spicules. To highlight the evolution of several prominent spicules, we marked spicular evolutions with white parabolic curves. These same curves are overplotted on the AIA 171 and 193 Å maps to illustrate the connection between spicular activity observed in the IRIS channel in panels (B) and (D) and PDs seen in the AIA channels in panels (A) and (C).
Other Images in This Article
Show More
Copyright and Terms & Conditions
© 2026. The Author(s). Published by the American Astronomical Society.