Image Details
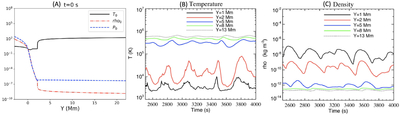
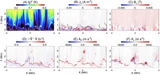
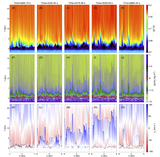
Caption: Figure 3.
The distributions of plasma parameters at different altitudes. Panel (A) shows the distributions of initial temperature, density, and pressure along the Y-direction, and they are normalized by using the reference values (T0 = 6530 K, rho0 = 2.734−4 kg m−3 and P0 = 11820 N m−2 ) at the bottom of the photosphere. The evolutions of temperature and density at different altitudes are presented in panels (B) and (D), and these values are the averaged ones in the X-direction.
Other Images in This Article
Show More
Copyright and Terms & Conditions
© 2026. The Author(s). Published by the American Astronomical Society.
Copyright ©
2026 Astronomy Image Explorer. All Rights Reserved.