Image Details
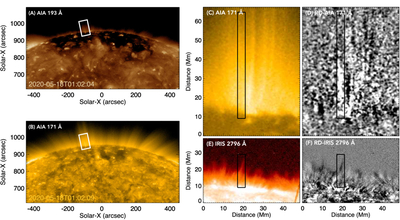
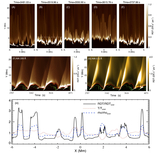
Caption: Figure 1.
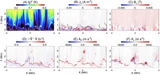
AIA and IRIS images taken around 01:02 UT on May 18, 2020. Panels (A) and (B) show coronal holes in the Sun’s south polar region, with the rectangular box marking the location of polar plumes. Panels (C) and (D) present a zoomed-in view and a running difference image of AIA 171 Å, respectively. The RD image highlights a PD, visible as an elongated white strip within the black box. The RD images are obtained by subtracting an image taken 2 minutes earlier. Panels (E) and (F) display the IRIS 2796 Å image and its corresponding RD image, clearly capturing a large spicule at this moment. The Y-axis of panels (C)–(F) starts from the bottom of the white box marked in panels (A) and (B). The black rectangular boxes in panels (C) and (E) mark the location of the artificial slits used to generate time–distance plots.
Other Images in This Article
Show More
Copyright and Terms & Conditions
© 2026. The Author(s). Published by the American Astronomical Society.