Image Details
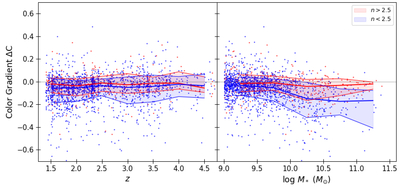
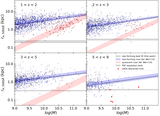
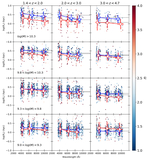
Caption: Figure 9.
Color gradient, as defined in Equation (3), is shown as a function of redshift and mass. Individual galaxy points are color coded according to their Sérsic index with n < 2.5 shown as blue, and n > 2.5 shown as red. The mean relation, along with the 16th−84th percentile range are shown for n < 2.5 and n > 2.5 galaxies as the blue and red lines and shaded regions, respectively. We find that there is no evidence for variation in color gradients as a function of redshift for either low- or high-Sérsic-index galaxies, and color gradients are slightly negative on average. We also find evidence for larger color gradients among the most massive galaxies, a trend that is most evident for low-n sources.
Other Images in This Article
Copyright and Terms & Conditions
© 2026. The Author(s). Published by the American Astronomical Society.