Image Details
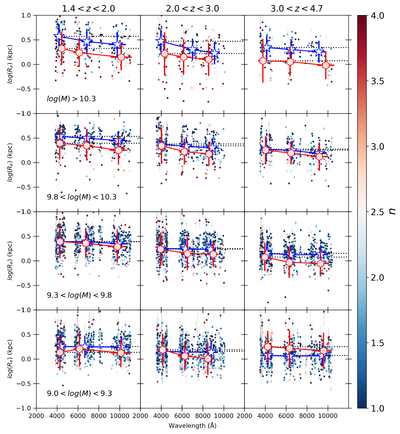
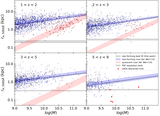
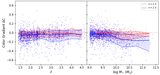
Caption: Figure 8.
Galaxy size is shown as a function of rest-frame wavelength in four different mass bins and three different redshift bins. Individual points are color coded by their Sérsic index, while the average values for n < 2.5 and n > 2.5 are shown, along with their 1σ spread, as blue stars and red circles, respectively. Dotted lines indicate the average size at the shortest wavelength, for reference. There is a clear trend that for the most massive galaxies, sizes are smaller at longer wavelengths for all redshifts probed. The trend is slightly less apparent in the highest-redshift bin for the highest-mass sources, but the number statistics are lower here, especially for n > 2.5 sources. The trend of smaller galaxy sizes at longer wavelengths breaks down somewhere between 9.3 < log(M) < 9.8 and there is no indication that galaxies with log(M) < 9.3 show any variation in size as a function of wavelength.
Other Images in This Article
Copyright and Terms & Conditions
© 2026. The Author(s). Published by the American Astronomical Society.