Image Details
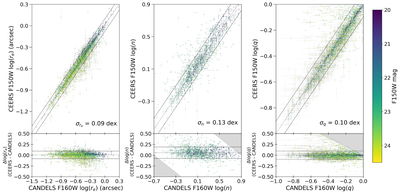
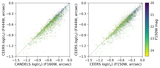
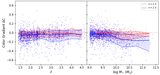
Caption: Figure 4.
From left to right we show a comparison between the measured effective radius, re; Sérsic index, n; and axis ratio, q for galaxies detected in both the CEERS and CANDELS surveys, restricted to galaxies with mF150W < 24.5 (re and q) or mF150W < 23.5 (n), where the CANDELS values are quoted to have random uncertainties less than ∼20% (A. van der Wel et al. 2012). CEERS values are from JWST/NIRCam F150W images, while CANDELS data points are from HST/WFC3 F160W images (A. van der Wel et al. 2012). The top panels show the 1:1 comparison between surveys while the bottom panels show the offset (in log space) of the CEERS values from CANDELS. The 1:1 correspondence is shown as a dotted line in each panel, along with the 1σ spread shown as the upper and lower dashed lines whose magnitude is quoted in the lower right corner of the top panels. For n, there is a noticeable offset in the best-fit value between CEERS and CANDELS, with the CEERS n values being larger by 0.055 dex (i.e., 14% larger in linear units), and we have offset the 1:1 line and corresponding spread by this amount accordingly. There is a slightly less noticeable offset between the CEERS and CANDELS re values, with the CEERS re values being 0.01 dex larger over this magnitude range. We have similarly offset the 1:1 line and corresponding spread by this value in the left-hand panels. Shaded regions in the lower middle and right panels indicate either unphysical regions of the parameter space, or regions disallowed by a constraint set on a parameter in one or both datasets.
Other Images in This Article
Copyright and Terms & Conditions
© 2026. The Author(s). Published by the American Astronomical Society.