Image Details
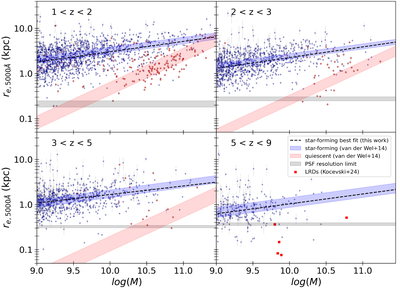
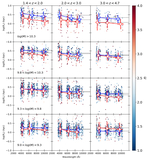
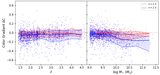
Caption: Figure 7.
Galaxy size as a function of mass in four redshift bins. Data points are color coded by their location in rest-frame UVJ color–color space (blue = star forming and red = quiescent). Shaded regions show the best-fit relations from A. van der Wel et al. (2014) extrapolated to each redshift range for star-forming and quiescent galaxies (blue and red, respectively). The dashed blue line in each plot is the best-fit linear relation for star-forming galaxies using the CEERS data. Some of the most compact sources at high z are identified as “Little Red Dots” (LRDs; D. D. Kocevski et al. 2025) and are excluded from the fit. The PSF resolution limit is shown as the horizontal gray shaded region for each redshift range.
Other Images in This Article
Copyright and Terms & Conditions
© 2026. The Author(s). Published by the American Astronomical Society.