Image Details
Caption: Figure 1.
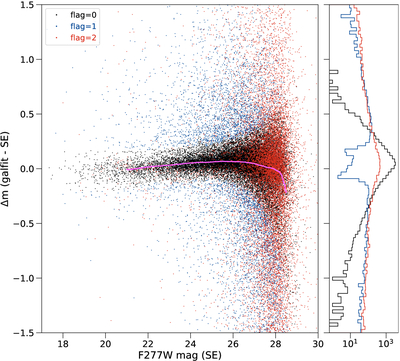
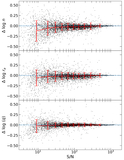
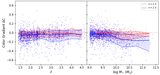
Left: difference between F277W GALFIT model magnitudes and SExtractor magnitudes for galaxies where the GALFIT solution converged successfully (89% of all sources). The magenta line shows the running median of the offset between the two magnitudes. Galaxies with good fits (flag = 0) are shown in black. Galaxies whose GALFIT magnitude is more than 3σ away from the median offset (flag = 1) are shown in blue. Galaxies whose fits reached a constraint limit in one or more parameters (flag = 2) are shown in red. Right: histogram of sources as a function of difference between the F277W GALFIT magnitude and SExtractor magnitude. Colors are the same as in the left-hand panel.
Other Images in This Article
Copyright and Terms & Conditions
© 2026. The Author(s). Published by the American Astronomical Society.