Image Details
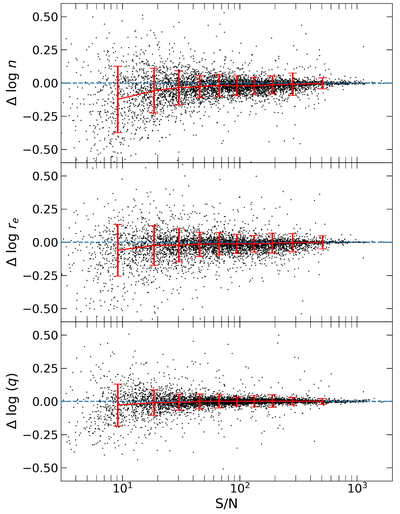
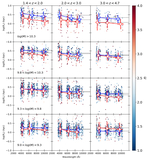
Caption: Figure 5.
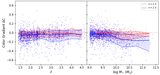
Difference between the recovered and input parameters for simulated galaxies as a function of SNR, where positive (negative) values represent larger (smaller) recovered parameters. Trends are shown in red for 10 bins containing equal numbers of galaxies. Error bars represent the dispersion of values within each SNR bin. The blue dashed line represents equality between the input and recovered parameters. Two features are evident: (1) at lower SNR, there is a larger dispersion, implying more uncertainty in the recovered parameters, and (2) at lower SNR we find that the parameters are biased toward smaller recovered values. For Sérsic index, n, we find the largest bias, reaching 0.12 dex at SNR = 10, while re is biased smaller by 0.05 dex and q by 0.025 dex at the same SNR.
Other Images in This Article
Copyright and Terms & Conditions
© 2026. The Author(s). Published by the American Astronomical Society.