Image Details
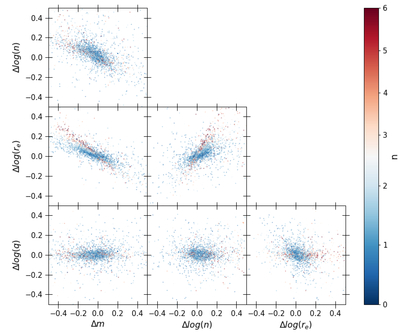
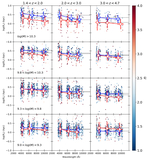
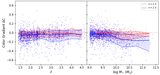
Caption: Figure 3.
Correlation between errors for simulated galaxies, presented as the difference between (recovered – input) values for each parameter of interest: m, n, re, and q. Objects whose recovered magnitudes are brighter than the truth tend to have larger recovered sizes and Sérsic indices (upper left and middle left panels, respectively). Likewise, objects with a larger recovered n tend to have larger recovered re values (middle panel). There is no obvious correlation between the errors in the axis ratio with the other parameters (bottom row).
Other Images in This Article
Copyright and Terms & Conditions
© 2026. The Author(s). Published by the American Astronomical Society.
Copyright ©
2026 Astronomy Image Explorer. All Rights Reserved.