Image Details
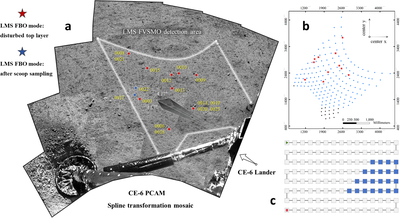
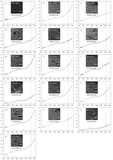
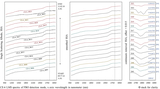
Caption: Figure A2.
Locations of all the soil targets in the LMS detection area. (a) All of the hyperspectral detection points in the whole region. (b) The projection on the lunar surface of the LMS observation vectors; the red stars correspond to the stars in panel (a). (c) The blue cells are some of the PCAM images we used to mosaic in panel (a).
Other Images in This Article
Copyright and Terms & Conditions
© 2026. The Author(s). Published by the American Astronomical Society.
Copyright ©
2026 Astronomy Image Explorer. All Rights Reserved.