Image Details
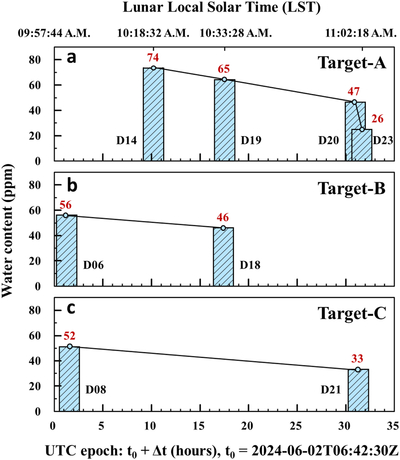
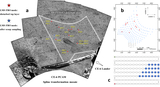
Caption: Figure 3.
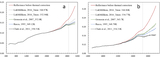
Water (OH/H2O) content variations of three targets within the lunar hourly time interval (10:00–11:00 a.m.). The bottom axis is the UTC epoch in hours past t0, while the top axis shows the corresponding lunar LST at the Chang’e-6 landing site. The estimated water contents are marked with the red values in ppm. (a) Target-A with four measurements (D14, D19, D20, D23 in order). We used the first three data to calculate the apparent desorption activation energy (Ed) of water molecules (see Section 3). (b) Target-B with two measurements (D06, D18 in order). (c) Target-C with two measurements (D08, D21 in order).
Other Images in This Article
Copyright and Terms & Conditions
© 2026. The Author(s). Published by the American Astronomical Society.