Image Details
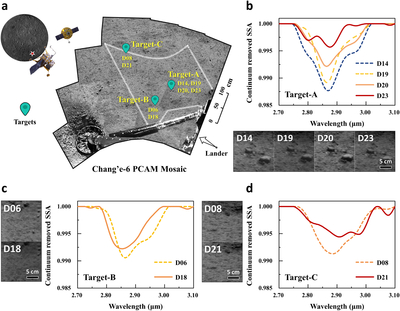
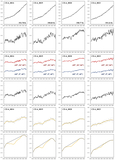
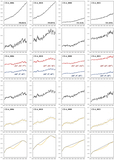
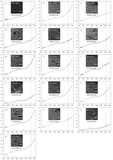
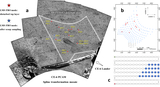
Caption: Figure 1.
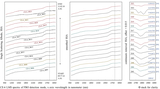
Detection area of LMS and the in situ spectral data of three targets used in this study. (a) The full detection area of LMS is marked with a white box in the Panoramic Camera (PCAM) mosaic image, and the three targets A, B, and C were analyzed by the hyperspectral observation mode with multiple measurements separately. (b) Target-A spectra and images: continuum-removed SSA at the absorption bands of water (OH/H2O; 2.70–3.10 μm) with four measurements (D14, D19, D20, D23 in order). The corresponding CMOS microscopic grayscale snapshots (∼1 mm pixel−1) @ 750 nm are presented as well. (c) Target-B continuum-removed spectra and CMOS images (D06, D18 in order). (d) Target-C continuum-removed spectra and CMOS images (D08, D21 in order).
Other Images in This Article
Copyright and Terms & Conditions
© 2026. The Author(s). Published by the American Astronomical Society.