Image Details
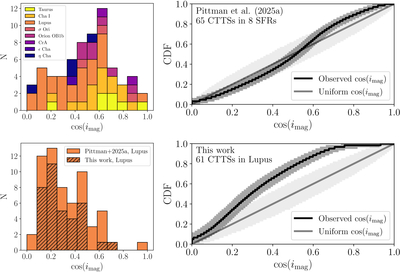
Caption: Figure 8.
Inclination uniformity test. Top: ﹩\cos ({i}_{{\rm{mag}}})﹩ histogram (left) and CDF (right) for the eight SFRs in C. V. Pittman et al. (2025a). The CDF figure shows the median and 95% confidence interval of the observed ﹩\cos ({i}_{{\rm{mag}}})﹩ values, as well as those of a uniform distribution. The observed ﹩\cos ({i}_{{\rm{mag}}})﹩ values are consistent with uniformity, within uncertainties. Bottom: same as the top panels, but for the Lupus sample in this work. These ﹩\cos ({i}_{{\rm{mag}}})﹩ values are inconsistent with uniformity.
Other Images in This Article

Copyright and Terms & Conditions
© 2025. The Author(s). Published by the American Astronomical Society.
Copyright ©
2025 Astronomy Image Explorer. All Rights Reserved.